PromQL tutorial for beginners and humans
PromQL is a query language for Prometheus monitoring system. It is designed for building powerful yet simple queries for graphs, alerts or derived time series (aka recording rules). PromQL is designed from scratch and has zero common grounds with other query languages used in time series databases such as SQL in TimescaleDB, InfluxQL or Flux.
This allowed creating a clear language for typical TSDB queries. But it has a cost — beginners usually need to spend a few hours reading the official PromQL docs before they understand how it works. Let’s flatten and shorten the learning curve for PromQL.
Selecting a time series with PromQL
Selecting a time series with PromQL is as simple as writing a time series name in the query. For instance, the following query would return all the time series with name node_network_receive_bytes_total:
node_network_receive_bytes_totalThis name corresponds to node_exporter metric containing the number of bytes received over the various network interfaces. Such a simple query may return multiple time series with the given name but with distinct set of labels. For instance, the query above may return time series with the following labels for eth0, eth1 and eth2 network interfaces:
node_network_receive_bytes_total{device="eth0"}
node_network_receive_bytes_total{device="eth1"}
node_network_receive_bytes_total{device="eth2"}
Distinct labels are set in curly braces: {device="eth0"}, {device="eth1"}, {device="eth2"}.
Let’s look at the same query in TimescaleDB’s SQL:
SELECT
  ts.metric_name_plus_tags,
  r.timestamps,
  r.values
FROM (
  (SELECT
    time_series_id,
    array_agg(timestamp ORDER BY timestamp) AS timestamps,
    array_agg(value ORDER BY timestamp) AS values
  FROM
    metrics
  WHERE
    time_series_id IN (
      SELECT id FROM time_series
      WHERE metric_name = 'node_network_receive_bytes_total'
    )
  GROUP BY
    time_series_id
  )
) AS r JOIN time_series AS ts ON (r.time_series_id = ts.id)
Easy, isn’t it? :) The SQL must be even more complex in order to be on par with the one-word PromQL query above, since it doesn’t take into account time ranges and down-sampling, which are automatically handled by /query_range API for PromQL with start, end and step args.
Filtering by label
A single metric name may correspond to multiple time series with distinct label sets as in the example above. How to select time series matching only {device="eth1"}? Just mention the required label in the query:
node_network_receive_bytes_total{device="eth1"}If you want selecting all the time series for devices other than eth1, then just substitute = with != in the query:
node_network_receive_bytes_total{device!="eth1"}How to select time series for devices starting with eth? Just use regular expressions:
node_network_receive_bytes_total{device=~"eth.+"}The filter may contain arbitrary regular expressions compatible with Go (aka RE2).
For selecting all the time series for devices not starting with eth, the =~ must be substituted with !~:
node_network_receive_bytes_total{device!~"eth.+"}Filtering by multiple labels
Label filters may be combined. For instance, the following query would return only time series on the instance node42:9100 for devices starting with eth:
node_network_receive_bytes_total{instance="node42:9100", device=~"eth.+"}Label filters are combined with and operator between them, i.e. “return time series matching that filter and this filter”. How to implement or operator? Currently PromQL lacks of or operator for combining label filters, but in the majority of cases it may be substituted by a regular expression. For instance, the following query would return time series for eth1 or lo devices:
node_network_receive_bytes_total{device=~"eth1|lo"}Side note: MetricsQL — PromQL-compatible query language from VictoriaMetrics — supports or operator inside curly braces. For example, the following query selects node_tework_receive_bytes_total metric from device="eth1" or from instance="node42:9100 :
node_network_receive_bytes_total{device="eth1" or instance="node42:9100"}See these docs for more details.
Filtering by regexps on metric name
Sometimes it is required returning all the time series for multiple metric names. Metric name is just an ordinary label with a special name — __name__. So filtering by multiple metric names may be performed by applying regexps on metric names. For instance, the following query returns all the time series with node_network_receive_bytes_total or node_network_transmit_bytes_total metric names:
{__name__=~"node_network_(receive|transmit)_bytes_total"}Comparing current data with historical data
PromQL allows querying historical data and combining / comparing it to the current data. Just add offset to the query. For instance, the following query would return week-old data for all the time series with node_network_receive_bytes_total name:
node_network_receive_bytes_total offset 7dThe following query would return points where the current GC overhead exceeds hour-old GC overhead by 1.5x.
go_memstats_gc_cpu_fraction > 1.5 * (go_memstats_gc_cpu_fraction offset 1h)Operations > and * are explained below.
Calculating rates
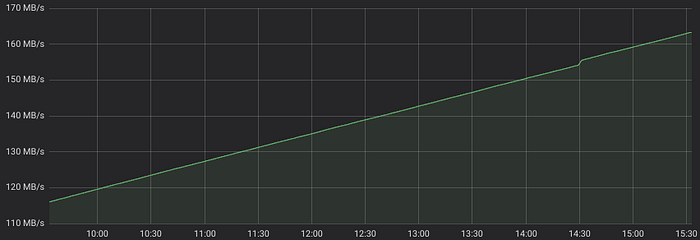
Careful readers could notice that Grafana draws constantly growing lines for all the queries above:

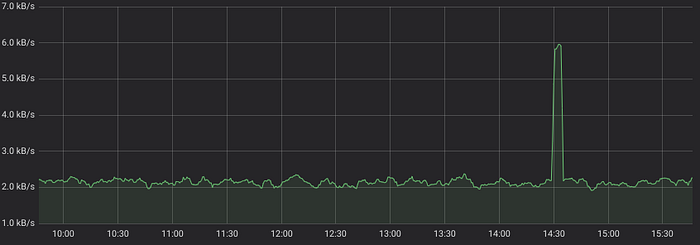
Usability of such graphs is close to zero, because they show hard-to-interpret constantly growing counter values, while we need graphs for network bandwidth — see MB/s on the left of the graph. PromQL has a magic function for this — rate(). It calculates per-second rate for all the matching time series:
rate(node_network_receive_bytes_total[5m])Now the graph becomes correct:

What does [5m] mean in the query? This is the time duration (d)— 5 minutes in our case — to look back when calculating per-second rate for each point on the graph. Simplified rate calculation for each point looks like (Vcurr-Vprev)/(Tcurr-Tprev), where Vcurr is the value at the current point — Tcurr, Vprev is the value at the point Tprev=Tcurr-d.
If this looks too complicated, then just remember — higher d smooths the graph, while lower d brings more noise to the graph. There is also PromQL extension supported by VictoriaMetrics, where [d] may be omitted — in this case it equals to the duration between two subsequent points on the graph (aka step):
rate(node_network_receive_bytes_total)Gotchas with rate
Rate strips metric name while leaving all the labels for the inner time series.
Do not apply rate to time series, which may go up and down. Such time series are called Gauges. Rate must be applied only to Counters, which always go up, but sometimes may be reset to zero (for instance, on service restart).
Do not use irate instead of rate, since it doesn’t capture spikes and it isn’t much faster than the rate.
Arithmetic operations
PromQL supports all the basic arithmetic operations:
- addition (+)
- subtraction (-)
- multiplication (*)
- division (/)
- modulo (%)
- power (^)
This allows performing various conversions. For example, converting bytes/s to bits/s:
rate(node_network_receive_bytes_total[5m]) * 8Additionally, this allows performing cross-time series calculations. For instance, the monstrous Flux query from this article may be simplified to the following PromQL query:
co2 * (((temp_c + 273.15) * 1013.25) / (pressure * 298.15))Combining multiple time series with arithmetic operations requires understanding matching rules. Otherwise the query may break or may lead to incorrect results. The basics of the matching rules are simple:
- PromQL engine strips metric names from all the time series on the left and right side of the arithmetic operation without touching labels.
- For each time series on the left side PromQL engine searches for the corresponding time series on the right side with the same set of labels, applies the operation for each data point and returns the resulting time series with the same set of labels. If there are no matches, then the time series is dropped from the result.
The matching rules may be augmented with ignoring, on, group_left and group_right modifiers. This is really complex, but in the majority of cases this isn’t needed.
Comparison operations
PromQL supports the following comparison operators:
- equal (==)
- not equal (!=)
- greater (>)
- greater-or-equal (>=)
- less (<)
- less-or-equal (<=)
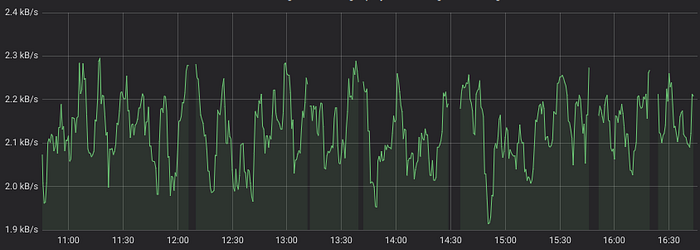
These operators may be applied to arbitrary PromQL expressions as with arithmetic operators. The result of the comparison operation is time series with the only matching data points. For instance, the following query would return only bandwidth smaller than 2300 bytes/s:
rate(node_network_receive_bytes_total[5m]) < 2300This would result in the following graph with gaps where the bandwidth exceeds 2300 bytes/s:

The result for comparison operator may be augmented with bool modifier:
rate(node_network_receive_bytes_total[5m]) < bool 2300In this case the result would contain 1 for true comparisons and 0 for false comparisons:

Aggregation and grouping functions
PromQL allows aggregating and grouping time series. Time series are grouped by the given set of labels and then the given aggregation function is applied for each group. For instance, the following query would return summary ingress traffic across all the network interfaces grouped by instances (nodes with installed node_exporter):
sum(rate(node_network_receive_bytes_total[5m])) by (instance)Working with Gauges
Gauges are time series that may go up and down at any time. For instance, memory usage, temperature or pressure. When drawing graphs for gauges it is expected to see min, max, avg and/or quantile values for each point on the graph. PromQL allows doing this with the following functions:
For example, the following query would graph minimum value for free memory for each point on the graph:
min_over_time(node_memory_MemFree_bytes[5m])VictoriaMetrics adds rollup_* functions to PromQL, which automatically return min, max and avg value when applied to Gagues. For instance:
rollup(node_memory_MemFree_bytes)Manipulations with labels
PromQL provides two functions for labels’ modification, prettifying, deletion or creation:
Though these functions are awkward to use, they allow powerful dynamic manipulations for labels on the selected time series. The primary use case for label_ functions is converting labels to the desired view.
VictoriaMetrics extends these functions with more convenient label manipulation functions:
label_set— sets additional labels to time serieslabel_del— deletes the given labels from time serieslabel_keep— deletes all the labels from time series except the given labelslabel_copy— copies label values to another labelslabel_move— renames labelslabel_transform— replaces all the substrings matching the given regex to template replacementlabel_value— returns numeric value from the given label
Returning multiple results from a single query
Sometimes it is necessary to return multiple results from a single PromQL query. This may be achieved with or operator. For instance, the following query would return all the time series with names metric1, metric2 and metric3:
metric1 or metric2 or metric3VictoriaMetrics simplifies returning multiple results — just enumerate them inside ():
(metric1, metric2, metric3)Note that arbitrary PromQL expressions may be put instead of metric names there.
There is a common trap when combining expression results: results with duplicate set of labels are skipped. For instance, the following query would skip sum(b), since both sum(a) and sum(b) have identical label set — they have no labels at all:
sum(a) or sum(b)Conclusions
PromQL is easy yet powerful query language for time series databases. It allows writing typical TSDB queries in concise yet clear way, especially when comparing to SQL, InfluxQL or Flux. It may not cover specific cases, which are supported by powerful SQL queries. But these cases are so rare in practice, that I couldn’t remember at least one at the moment. Mention such cases in comments if you are aware of them.
The tutorial doesn’t cover all the functionality of PromQL, since it is rarely used by beginners:
- It doesn’t mention a lot of functions and logical operators.
- It doesn’t cover subqueries.
- It doesn’t cover common table expressions from MetricsQL (aka
CTEor WITH templates), which allows simplifying complex PromQL queries with many repeated label filters templated in Grafana. - It doesn’t cover other useful features from MetricsQL supported by VictoriaMetrics.
I’d recommend continuing learning PromQL with this cheat sheet.
Update #1: VictoriaMetrics is open source now! Investigate the source code in order to understand how it implements MetricsQL. Join our Slack chat.
Update #2: check out the article explaining Prometheus-related tech terms.
Update #2: read how to optimize PromQL queries in Prometheus.
