Prometheus vs VictoriaMetrics benchmark on node_exporter metrics
Recently single-node VictoriaMetrics gained support for scraping Prometheus targets. This made possible to run apples-to-apples benchmark, which compares resource usage for Prometheus and VictoriaMetrics during scraping big number of real node_exporter targets.
Benchmark setup
The benchmark was run in Google Compute Engine on four machines (instances):
- An instance with node_exporter v1.0.1 for scraping. It was run on e2-standard-4 machine with the following config: 4vCPU, 16GB RAM, 1TB HDD persistent disk. Initial tests revealed that the
node_exportercannot process more than a few hundred requests per second. Prometheus and VictoriaMetrics were generating much higher load on thenode_exporterduring tests. So it has been decided to putnginxin front ofnode_exporterwith one-second response caching. This lowered load onnode_exporterto reasonable values, so it could process all the incoming requests without scrape errors. - Two dedicated e2-highmem-4 instances for Prometheus v2.22.2 and VictoriaMetrics v1.47.0 with the following configs: 4vCPU, 32GB RAM, 1TB HDD persistent disk. Both VictoriaMetrics and Prometheus were run with default configs except of the path to the file with scrape configs (i.e.
-promscrape.config=prometheus.ymlfor VictoriaMetrics and— config.file=prometheus.ymlfor Prometheus). Theprometheus.ymlfile has been generated from the following Jinja2 template:
global:
  scrape_interval: 10s
scrape_configs:
  - job_name: node_exporter
    static_configs:
{% for n in range(3400) %}
      - targets: ['host-node-{{n}}:9100']
        labels:
          host_number: cfg_{{n}}
          role: node-exporter
          env: prod
{% endfor %}
All the host-node-{{n}} hostnames were pointed to the machine with node_exporter target. They were put in /etc/hosts. This emulated scraping from 3400 node_exporter targets.
- An e2-standard-2 machine for monitoring VictoriaMetrics and Prometheus. VictoriaMetrics instance on this machine has been configured for scraping app-specific metrics and
node_exportermetrics from machines with VictoriaMetrics and Prometheus. Graphs below were built from these metrics.
The node_exporter has been chosen as scrape target because of the following reasons:
node_exporteris the most widespread exporter, which is scraped by the majority of Prometheus installations.node_exporterexports real-world metrics (CPU usage, RAM usage, disk IO usage, network usage, etc.) under load, so benchmark results could be extrapolated to production Prometheus setups.
Ubuntu 20.04 has been installed on all the machines mentioned above.
Both VictoriaMetrics and Prometheus were started at the same time for scraping the same target node_exporter. The benchmark duration was 24 hours.
Storage stats
Let’s look at storage stats, which is the same for both VictoriaMetrics and Prometheus:
- Ingestion rate: 280K samples/sec
- Active time series: 2.8 million
- Samples scraped and stored: 24.5 billion
Benchmark results
Disk space usage:

Prometheus generates 15GB disk space usage spikes at regular intervals, while VictoriaMetrics generates infrequent and much smaller disk space usage spikes. The maximum spike for VictoriaMetrics is 4GB. Let’s look at final disk space usage stats:
- VictoriaMetrics: 7.2GB . This translates to 0.3 bytes per sample (7.2GB/24.5 billion samples).
- Prometheus: 52.3GB (32.3GB data plus 18GB WAL). This translates to 52.3GB/24.5 billion samples = 2.1 bytes per sample. This means that Prometheus requires up to 7 times (2.1/0.3) more storage space than VictoriaMetrics for storing the same amounts of data.
Disk IO usage:

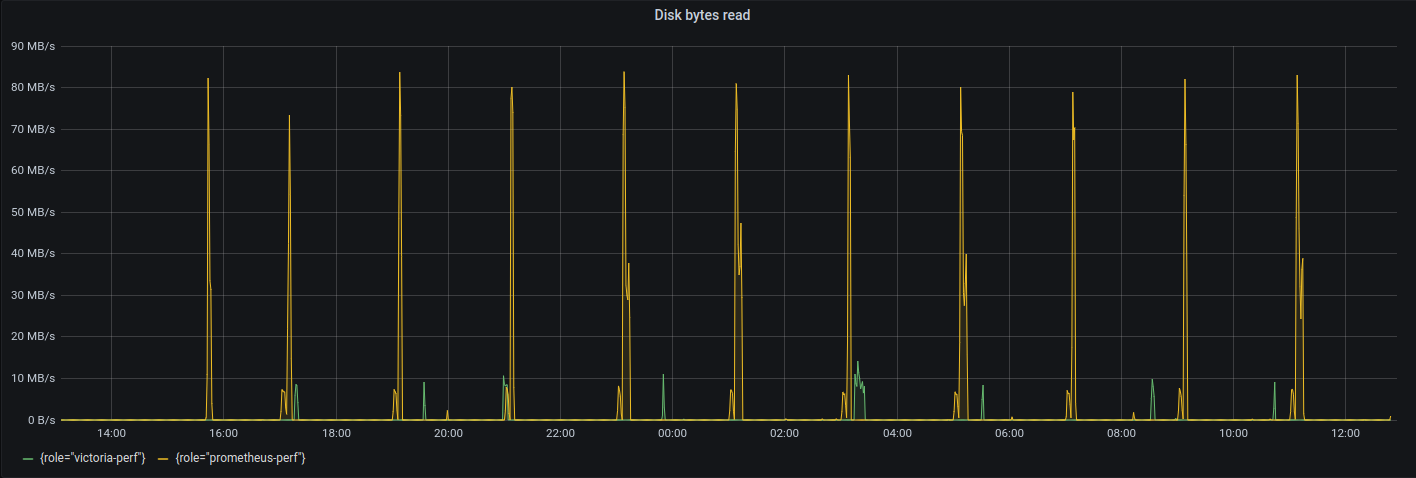
Both VictoriaMetrics and Prometheus write data to disk at roughly 2MB/s speed when collecting 280K samples per second. Prometheus generates more disk write spikes with much higher values reaching 50MB/s, while the maximum disk write spike for VictoriaMetrics is 15MB/s.
As for disk read side, Prometheus generates spikes for up to 95MB/s at regular intervals, while the maximum disk read spike for VictoriaMetrics is 15MB/s.
CPU usage:

Both VictoriaMetrics and Prometheus have similar CPU usage patterns:
- 1.5–1.75 of vCPU cores are used by both systems for scraping 3400
node_exportertargets. This means that 4vCPU system has enough capacity for scraping additional 4000node_exportertargets. - CPU usage spikes for both systems are related to background data compaction. These spikes are mostly harmless for VictoriaMetrics, while they may result in OOM (out of memory) crashes for Prometheus as explained below. See technical details about background compaction (aka merge) in VictoriaMetrics at these docs.
Memory usage:
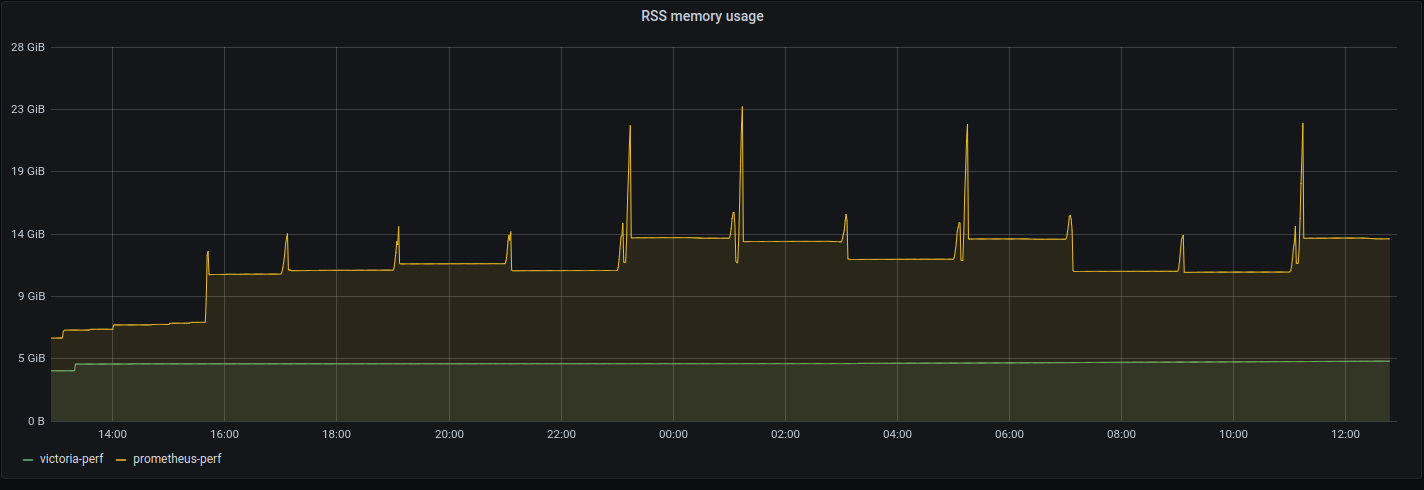
VictoriaMetrics consistently uses 4.3GB of RSS memory during benchmark duration, while Prometheus starts from 6.5GB and stabilizes at 14GB of RSS memory with spikes up to 23GB. These memory usage spikes frequently result in OOM crashes and data loss if the machine has no enough memory or there are memory limits for Kubernetes pod with Prometheus. Fortunately, the test machine had 32GB of RAM, so no crashes have been observed :) Read this article if you want to know technical details on why Prometheus can lose data after unclean shutdown such as OOM crash.
According to the graph above Prometheus requires up to 5.3 times (23GB/4.3GB) more RAM than VictoriaMetrics.
Conclusions
Both Prometheus and VictoriaMetrics can scrape millions of metrics from thousands of targets on a machine with a couple of vCPU cores. This is much better result comparing to InfluxDB or TimescaleDB systems according to these benchmarks.
VictoriaMetrics needs up to 5x less RAM and up to 7x less disk space comparing to Prometheus when scraping thousands of node_exporter targets. This translates to significant infrastructure cost savings.
P.S. If you didn’t use VictoriaMetrics yet, then it is time to try it. VictoriaMetrics is free and open source (including cluster version)— https://github.com/VictoriaMetrics/VictoriaMetrics/ . If you need enterprise features and support, then visit https://victoriametrics.com/ .
Update: we open-sourced realistic Prometheus benchmark, which can be used for comparing performance for various Prometheus-compatible storage solutions such as Promscale, M3DB, Cortex and Thanos — see this announcement.
