High-cardinality TSDB benchmarks: VictoriaMetrics vs TimescaleDB vs InfluxDB
Intro
VictoriaMetrics, TimescaleDB and InfluxDB have been benchmarked in the previous article on a dataset with a billion datapoints belonging to 40K unique time series.
A few years ago there was Zabbix epoch. Each bare metal server had no more than a few metrics — CPU usage, RAM usage, Disk usage and Network usage. So metrics from thousands of servers could fit into 40K unique time series and Zabbix could use MySQL as a backend for time series data :)
Currently a single node_exporter with default configs exposes more than 500 metrics on an average host. There are many exporters exist for various databases, web servers, hardware systems, etc. All of them expose many useful metrics. More and more apps start exposing various metrics on itself. There is a Kubernetes with Clusters and Pods exposing many metrics. This leads to servers exposing thousands of unique metrics per host. So 40K unique time series is no longer a high cardinality. It becomes mainstream, which must be easily processed by any modern TSDB on a single-server.
What is a big number of unique time series at the moment? Probably, 400K or 4M? Or 40M? Let’s benchmark modern TSDBs with these numbers.
Benchmark setup
TSBS is a great benchmarking tool for TSDBs. It allows generating arbitrary number of metrics by passing the required number of time series divided by 10 to -scale flag (former -scale-var). 10 is the number of measurements (metrics) generated per each scale host. The following datasets have been generated with TSBS for the benchmark:
- 400K unique time series, 60 seconds interval between data points, data covers full 3 days, ~1.7B total number of data points.
- 4M unique time series, 600 seconds interval, data covers full 3 days, ~1.7B total number of data points.
- 40M unique time series, 1 hour interval, data covers full 3 days, ~2.8B total number of data points.
Client and server were run on a dedicated n1-standard-16 instances in Google Cloud. These instances had the following configs:
- vCPUs: 16
- RAM: 60GB
- Storage: 1TB standard HDD disk. It provides 120MB/s read/write throughput, 750 read operations per second and 1.5K write operations per second.
TSDBs were pulled from official docker images and were run in docker with the following configs:
- VictoriaMetrics:
docker run -it --rm -v /mnt/disks/storage/vmetrics-data:/victoria-metrics-data -p 8080:8080 valyala/victoria-metrics
- InfluxDB (
-evalues are required for high cardinality support. See the docs for details):
docker run -it --rm -p 8086:8086 \
-e INFLUXDB_DATA_MAX_VALUES_PER_TAG=4000000 \
-e INFLUXDB_DATA_CACHE_MAX_MEMORY_SIZE=100g \
-e INFLUXDB_DATA_MAX_SERIES_PER_DATABASE=0 \
-v /mnt/disks/storage/influx-data:/var/lib/influxdb influxdb
- TimescaleDB (the config has been adopted from this file):
MEM=`free -m | grep “Mem” | awk ‘{print $7}’`
let “SHARED=$MEM/4”
let “CACHE=2*$MEM/3”
let “WORK=($MEM-$SHARED)/30”
let “MAINT=$MEM/16”
let “WAL=$MEM/16”docker run -it — rm -p 5432:5432 \
--shm-size=${SHARED}MB \
-v /mnt/disks/storage/timescaledb-data:/var/lib/postgresql/data \
timescale/timescaledb:latest-pg10 postgres \
-cmax_wal_size=${WAL}MB \
-clog_line_prefix=”%m [%p]: [%x] %u@%d” \
-clogging_collector=off \
-csynchronous_commit=off \
-cshared_buffers=${SHARED}MB \
-ceffective_cache_size=${CACHE}MB \
-cwork_mem=${WORK}MB \
-cmaintenance_work_mem=${MAINT}MB \
-cmax_files_per_process=100
Data loader was run with 16 concurrent threads.
This article contains only results for insert benchmarks. Select benchmark results will be published in a separate article.
400K unique time series
Let’s start with easy cardinality — 400K. Benchmark results:
- VictoriaMetrics: 2.6M datapoints/sec; RAM usage: 3GB; final data size on disk: 965MB
- InfluxDB: 1.2M datapoints/sec; RAM usage: 8.5GB; final data size on disk: 1.6GB
- Timescale: 849K datapoints/sec; RAM usage: 2.5GB; final data size on disk: 50GB
As you can see from the results above, VictoriaMetrics wins in insert performance and in compression ratio. Timescale wins in RAM usage, but it uses a lot of disk space — 29 bytes per data point.
Below are CPU usage graphs for each of TSDBs during the benchmark:
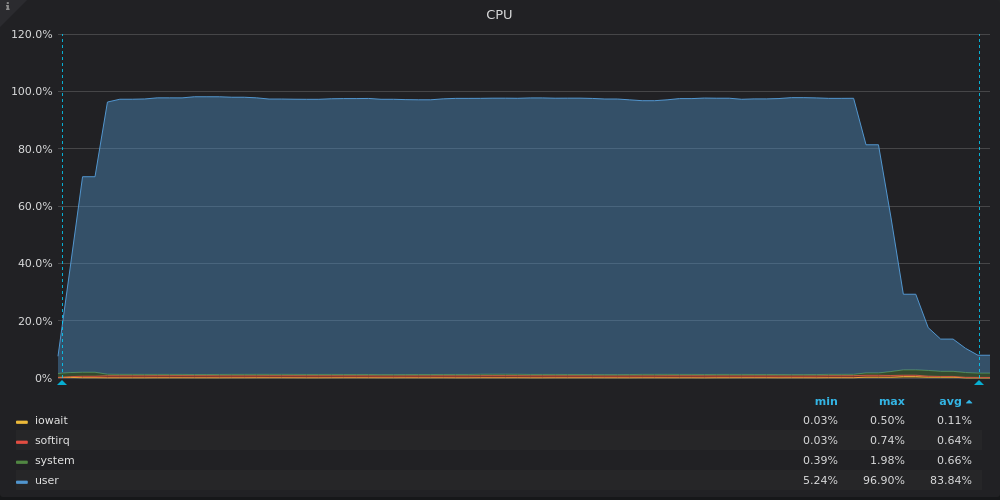
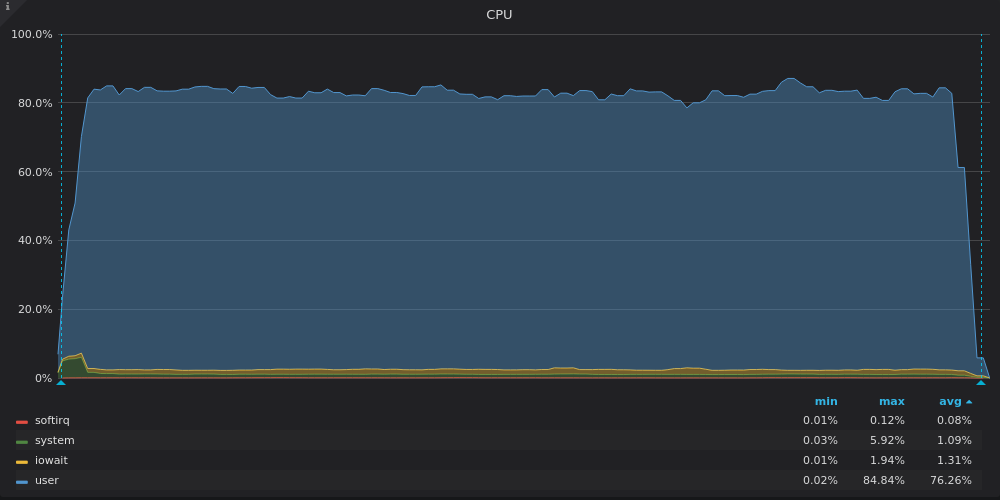

VictoriaMetrics utilizes all the available vCPUs, while InfluxDB under-utilizes ~2 out of 16 vCPUs.
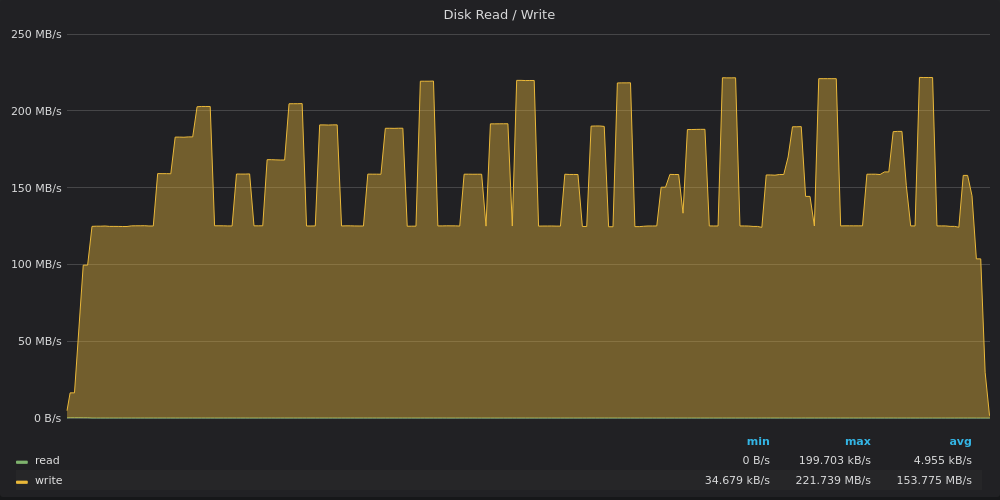
Timescale utilizes only 3–4 out of 16 vCPUs. High iowait and system shares on TimescaleDB graph point to a bottleneck in I/O subsystem. Let’s look at disk bandwidth usage graphs:


VictoriaMetrics writes data at 20MB/s with peaks up to 45MB/s. Peaks correspond to big part merges in the LSM tree.
InfluxDB writes data at 160MB/s, while 1TB disk should be limited to 120MB/s write throughput according to the docs.
TimescaleDB is limited by 120MB/s write throughput, but sometimes it breaks the limit and reaches 220MB/s in peaks. These peaks correspond to CPU under-utilization dips on the previous graph.
Let’s look at I/O usage graphs:
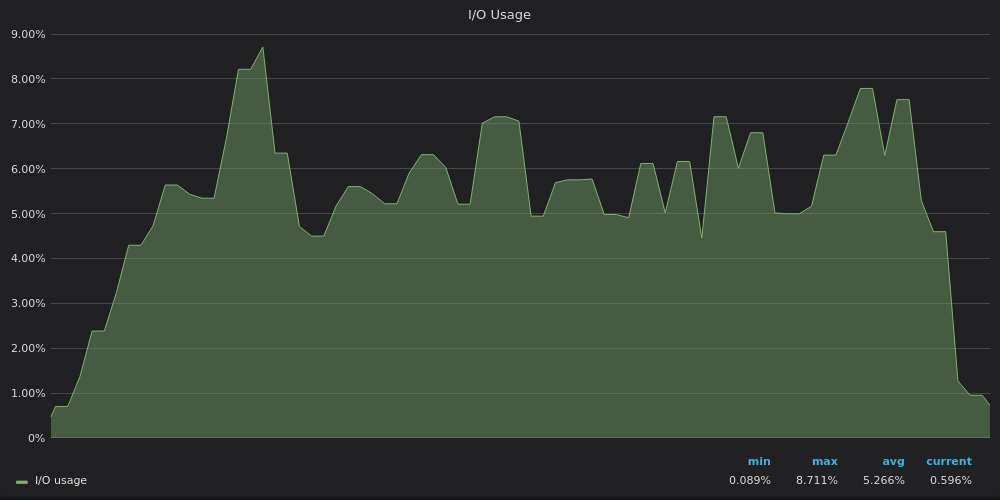


It is clear now that TimescaleDB reaches I/O limit, so it cannot utilize the remaining 12 vCPUs.
4M unique timeseries
4M time series look a little challenging. But our competitors successfully pass this exam. Benchmark results:
- VictoriaMetrics: 2.2M datapoints/sec; RAM usage: 6GB; final data size on disk: 3GB.
- InfluxDB: 330K datapoints/sec; RAM usage: 20.5GB; final data size on disk: 18.4GB.
- TimescaleDB: 480K datapoints/sec; RAM usage: 2.5GB; final data size on disk: 52GB.
InfluxDB performance dropped from 1.2M datapoints/sec for 400K time series to 330K datapoints/sec for 4M time series. This is significant performance loss comparing to other competitors. Let’s look at CPU usage graphs in order to understand the root cause of this loss:
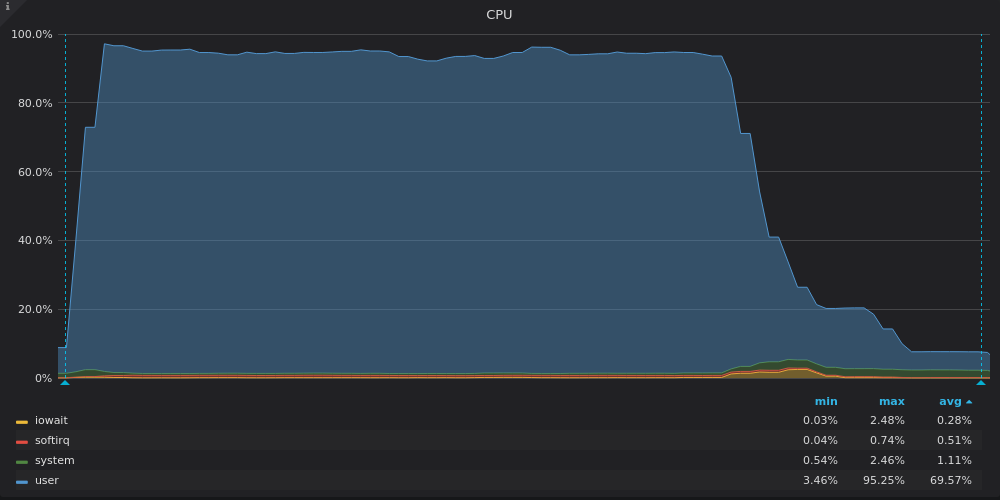
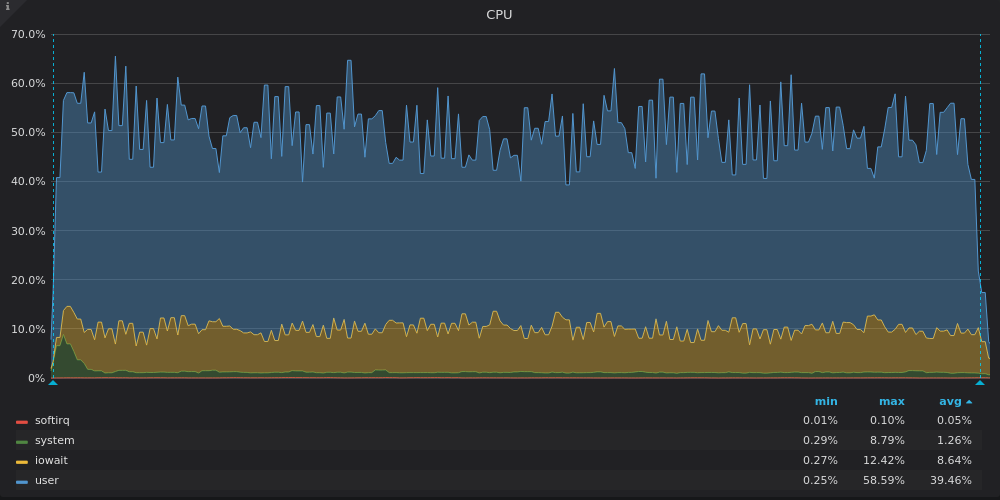

VictoriaMetrics utilizes almost all the CPU power. The decline at the end corresponds to remaining LSM merges after all the data is inserted.
InfluxDB utilizes only 8 out of 16 vCPUs, while TimsecaleDB utilizes 4 out of 16 vCPUs. What their graphs have in common? High iowait share, which, again, points to I/O bottleneck.
TimescaleDB has high system share. Guess high cardinality led to many syscalls or to many minor page faults.
Let’s look at disk bandwidth graphs:

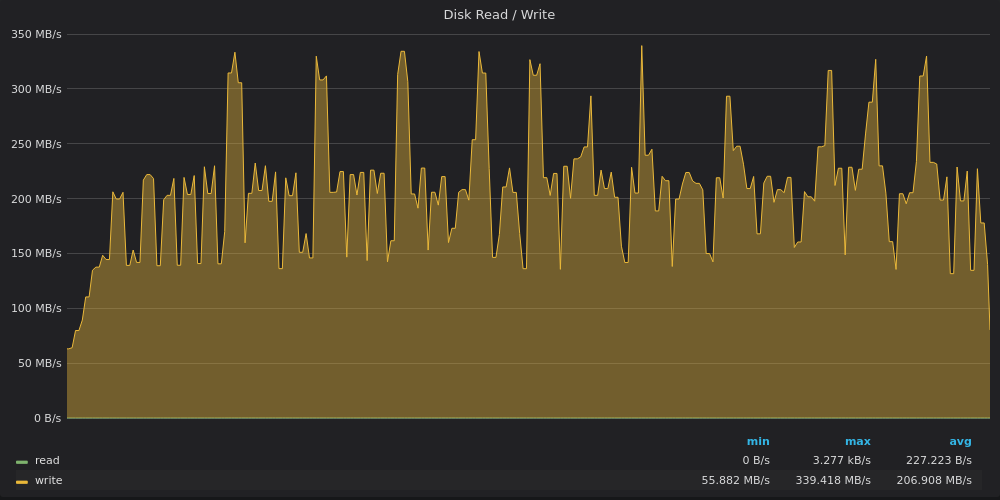

VictoriaMetrics reached 120MB/s limit in a peak, while the average write speed was 40MB/s. Probably multiple heavy LSM merges were performed during the peak.
InfluxDB again squeezes out 200MB/s average write throughput with peaks up to 340MB/s on a disk with 120MB/s write limit :)
TimescaleDB is no longer limited by disk. It looks like it is limited by something else related to highsystem CPU share.
Let’s look at IO usage graphs:
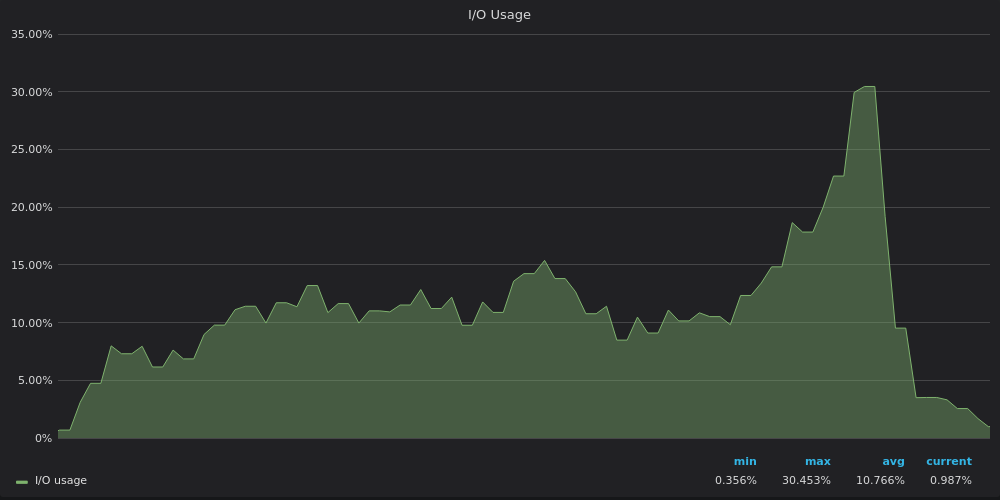


IO usage graphs repeat disk bandwidth usage graphs — InfluxDB is limited by IO, while VictoriaMetrics and TimescaleDB have spare IO resources.
40M unique time series
40M unique time series was too much for InfluxDB :(
Benchmark results:
- VictoriaMetrics: 1.7M datapoints/sec; RAM usage: 29GB; disk space usage: 17GB.
- InfluxDB: didn’t finish because it required more than 60GB of RAM.
- TimescaleDB: 330K datapoints/sec; RAM usage: 2.5GB; disk space usage: 84GB.
TimescaleDB shows outstandingly low and stable RAM usage — 2.5GB — the same amount as for 4M and 400K unique metrics.
VictoriaMetrics was ramping up slowly at 100K datapoints/sec until all the 40M metric names with labels were processed. Then it reached steady insertion speed of 1.5M–2.0M datapoints/sec, so the end result was 1.7M datapoints/sec.
Graphs for 40M unique time series are similar to graphs for 4M unique time series, so let’s skip them.
Conclusions
- Modern TSDBs are able to process
insertsfor millions of unique time series on a single server. We’ll check in the next article how well TSDBs performselects over millions of unique time series. - CPU under-utilization usually points to I/O bottleneck. Additionally it may point to too coarse locking when only a few threads may run concurrently.
- I/O bottleneck is real, especially on non-SSD storages such as cloud providers’ virtualized block devices.
- VictoriaMetrics provides the best optimizations for slow storages with low iops. It provides the best speed and the best compression ratio.
Download single-server VictoriaMetrics image and try it on your data. The corresponding static binary is available on GitHub.
Read more info about VictoriaMetrics in this article.
Update: published an article comparing VictoriaMetrics insert performance with InfluxDB with reproducible results.
Update#2: read also an article about vertical scalability of VictoriaMetrics vs InfluxDB vs TimescaleDB.
Update #3: VictoriaMetrics is open source now!
