Billy: how VictoriaMetrics deals with more than 500 billion rows
Recently ScyllaDB published an interesting article How Scylla scaled to one billion rows per second. They conducted a benchmark (named Billy) for a typical time series workload, which simulates a million temperature sensors reporting every minute for a year’s worth of data. This translates to 1M*60*24*365=525.6 billion data points. The benchmark was run on beefy servers from Packet:
- 83 ScyllaDB nodes running on n2.xlarge.x86 servers
- 24 worker nodes running on c2.medium.x86 servers
ScyllaDB cluster achieved scan speed of more than 1 billion of data points per second on this setup. Later ClickHouse provided good results for slightly modified Billy benchmark on a commodity hardware. Let’s see how a single-node VictoriaMetrics deals with this workload on n2.xlarge.x86 machine from Packet.
What is VictoriaMetrics?
VictoriaMetrics is scalable open source time series database, which can be used as long-term remote storage for Prometheus. It has the following features:
- It is easy to setup and operate.
- It is optimized for low resource usage — RAM, CPU, network, disk space and disk io.
- It understands PromQL, so it can be used as drop-in replacement for Prometheus in Grafana.
- It accepts time series data via popular protocols — Prometheus, Influx, Graphite, OpenTSDB.
Check out GitHub project for VictoriaMetrics at https://github.com/VictoriaMetrics/VictoriaMetrics .
The setup
3.8TB NVMe drive on n2.xlarge.x86 has been formatted as ext4 and mounted to /mnt/disks/billy folder using the following commands:
mkfs.ext4 -m 0 -E lazy_itable_init=0,lazy_journal_init=0,discard -O 64bit,huge_file,extent -T huge /dev/nvme0n1mount -o discard,defaults /dev/nvme0n1 /mnt/disks/billy
The following script was used for running VictoriaMetrics v1.32.5 on n2.xlarge.x86 node:
https://github.com/VictoriaMetrics/billy/blob/master/scripts/start_victoria_metrics.sh .
Benchmark data has been ingested into VictoriaMetrics from two c2.medium.x86 nodes using the following scripts run in parallel:
- https://github.com/VictoriaMetrics/billy/blob/master/scripts/load_data_500K_client1.sh
- https://github.com/VictoriaMetrics/billy/blob/master/scripts/load_data_500K_client2.sh
The following line must be added to /etc/hosts on client nodes in order to run the scripts:
internal.ip.of.billy-server billy-serverWhere internal.ip.of.billy-server is internal IP address of the node where VictoriaMetrics runs. This address can be obtained via Packet.com console.
Each ingested row looks like the following:
temperature{sensor_id="12345"} 76.23 123456789Where 76.23 is a temperature for sensor_id 12345 at timestamp 123456789.
Source code for the executable used for data ingestion is available at https://github.com/VictoriaMetrics/billy/blob/master/main.go .
The following script is used for inserting a “needle” in the haystack, i.e. temperature value out of default range — https://github.com/VictoriaMetrics/billy/blob/master/scripts/write_needle.sh .
The following queries were used for measuring SELECT performance:
https://github.com/VictoriaMetrics/billy/tree/master/queries
Standard node_exporter has been used for collecting OS-level metrics from n2.xlarge.x86 node during the benchmark.
Data ingestion
525.6 billion of rows have been loaded into a single-node VictoriaMetrics in 2 hours 12 minutes. The average ingestion speed was 525.6e9/(2*3600+12*60)=66 million data points per second. This means that a single-node VictoriaMetrics is able to accept a trillion of data points in 4.5 hours or 66M*3600*24=5.7 trillion samples per day.
Let’s look at resource usage graphs for VictoriaMetrics node during data ingestion. The first graph shows CPU usage during data ingestion:

As you can see, VictoriaMetrics consistently uses almost all the CPU cores during data ingestion. This shows good vertical scalability for data ingestion path with the number of available CPU cores.
The next graph shows network usage during data ingestion:

According to this graph, VictoriaMetrics accepts data stream at the speed of 1.3-1.6 Gbytes per second. Gradual slowdown from 1.6 to 1.3 Gbytes per second could be related to the increased usage of disk iops and bandwidth during the data ingestion — see graphs below:
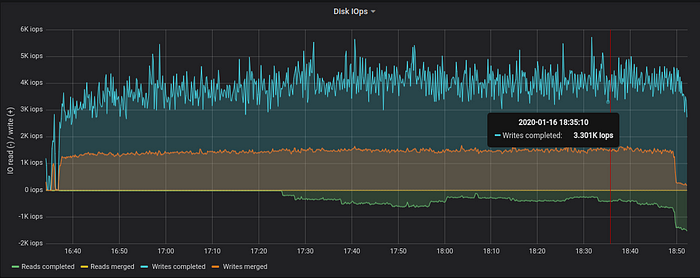
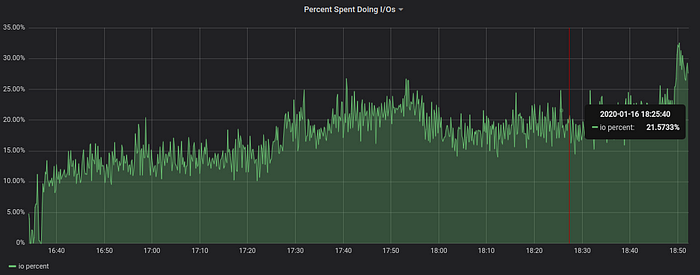
The data ingestion generates 4K disk write operations per second. This corresponds to 10%-20% of available iops bandwidth for the used NVMe drive on n2.xlarge.x86 node. 30% jump in iops usage after 18:49 corresponds to “final” merge of LSM tree — VictoriaMetrics noticed that data ingestion has been stopped, so it had enough resources for starting “final” merge. The end result of “final” merge is faster queries and lower disk space usage.
The next graph shows disk bandwidth usage during data ingestion:

Disk write bandwidth usage stays around 500–600 MB/s. Spikes up to 3.5 GB/s correspond to source parts’ deletion after successful merges in LSM tree — the OS issues Trim command to NVMe drive when deleting big files. See this article for details about LSM trees in VictoriaMetrics.
Let’s look at RAM usage during data ingestion:

VictoriaMetrics consistently uses 12–13 GB or RAM during the ingestion of 525.6 billion of rows — see green area at the bottom of the graph above. This memory is mainly used for buffers containing recently ingested data, which isn’t written to persistent storage yet.
The yellow area corresponds to OS page cache, which improves performance when reading data from recently written or recently read files. Such data is read directly from RAM instead of reading it from persistent storage.
The next graph shows disk space usage during data ingestion:

According to the graph, 525.6 billion of rows occupy 595 GB after “final” merge ends at 19:23. This means that each inserted row occupies less than 595/525.6=1.2 bytes after the “final” merge.
Peak disk space usage was at 18:55 — 791 GB — when multiple concurrent “final” merges were running. The “sawtooth” shape of the graph reflects LSM tree merge process, when multiple smaller parts are merged into bigger part and then deleted after successful merge.
Data querying: 130 billion of data points
Now the database contains 525.6 billion of data points. Let’s start querying it. The first PromQL query finds the maximum temperature for 90 days over all the 1M time series:
max(max_over_time(temperature[90d]))The query works in two steps:
- At the first step it selects maximum value for each time series over 90 days —
max_over_time(temperature[90d]). - At the second step it selects the maximum value over all the time series —
max(...).
If you are unfamiliar with PromQL, then read this tutorial for beginners.
See the corresponding script for running the query — https://github.com/VictoriaMetrics/billy/blob/master/queries/three_months.sh .
This query scans 1M*60*24*90=129.6 billion of rows. Data for such amount of rows fits available RAM on n2.xlarge.x86 node — 384 GB. Single-node VictoriaMetrics performs this query in 360–420 seconds on a n2.xlarge.x86 node. This results in scan speed of up to 129.6B/360s=360 million data points per second. Below are various resource usage graphs for 3 consecutive runs of this query.
The first graph shows disk space usage:

VictoriaMetrics uses up to 150 GB of additional disk space for storing temporary data during the query. This size is roughly equivalent to the total compressed size of 130 billion of rows that needs to be scanned: 130B*1.2bytes/row=156 GB.
VictoriaMetrics doesn’t use RAM for storing temporary data as could be seen from RAM usage graph below. This allows running queries over big amounts of data that don’t fit available RAM.
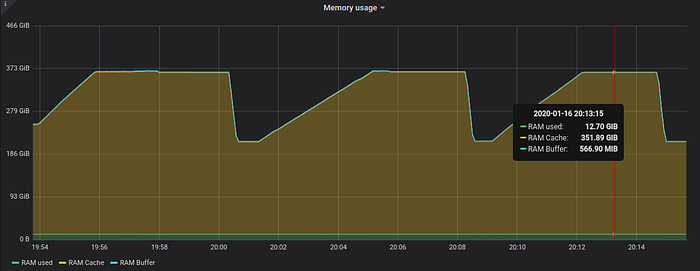
VictoriaMetrics uses 12.7 GB of RAM during the queries (see green area at the bottom of the graph), while OS page cache grows by 150 GB (yellow area) during each query and then drops to the original levels when temporary file is deleted.
The next graph shows disk bandwidth usage during the queries:
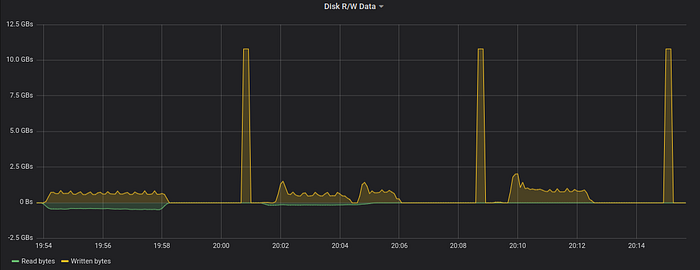
10 GB/s spikes for disk write speed correspond to deletion of temporary files with Trim command. The average disk read speed during the first run of the query was around 450 MB/s. It has been lowered to 140 MB/s during the second run and then dropped to 0 during the last run. Why? The n2.xlarge.x86 node has 384 GB of RAM. The OS puts all the 150 GB of the original data for the query into page cache after the second run, so all this data is read from RAM during the last run. Note that the data is still persisted to a temporary file during all the runs. Disk iops usage graph confirms this:
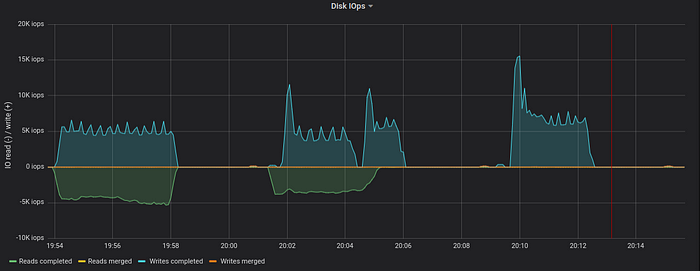
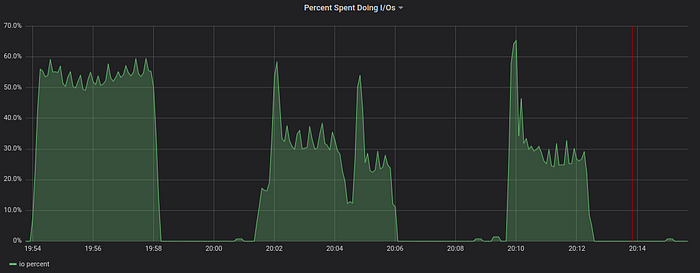
The NVMe drive easily handles 15K+ write operations per second at 65% capacity. This correspond to write speed of more than 2 GB per second.
Now let’s look at CPU usage graphs:
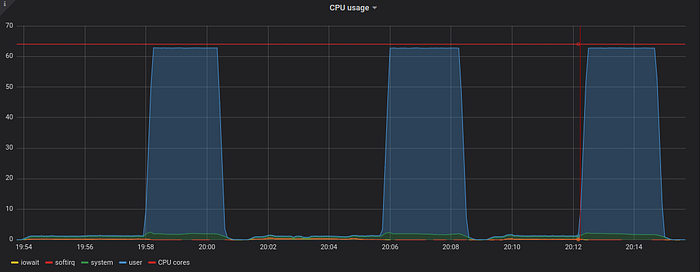
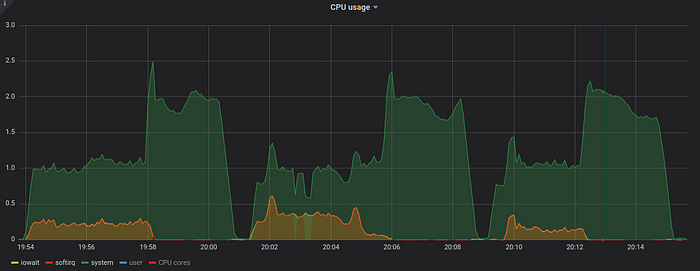
Graphs above show that the query life is split into two stages:
- Streaming the data required for query processing to a temporary file — see time ranges with growing disk space usage. CPU cores are mostly idle during this stage, since this is mostly disk IO-bound stage. VictoriaMetrics prepares data in temporary file for fast consumption during the second stage.
- Parallel processing of the data from temporary file using all the available CPU cores — see CPU usage spikes on the graph above. This stage is usually CPU-bound. Scan speed during the second stage reaches one billion data points per second according to time ranges for high CPU usage on the graph above.
Data querying: 525.6 billion of data points
It’s time to push limits and scanning all the 525.6 billion of data points in one run. 595 GB of original data don’t fit available RAM on the server, so results should be quite different comparing to the previous case. The following scripts were used for querying:
- https://github.com/VictoriaMetrics/billy/blob/master/queries/full_year_parallel.sh — for the first run. It splits the original query into three sub-queries over non-overlapping time series and runs these queries in parallel.
- https://github.com/VictoriaMetrics/billy/blob/master/queries/full_year_serial.sh — for the last two runs. It runs a single query over all the data in the database.
The query takes 1380 seconds on average, which translates to scan speed of 525.6B/1380s=380 million data point per second.
Below are graphs for 3 consecutive runs of the query. The first graph is for disk space usage:

Disk space usage doubles during each query. This means that all the data is copied to a temporary file during the first stage of the query.
Now let’s look at memory usage:

Memory usage for VictoriaMetrics process increased to 49 GB during the first run when parallel queries are run. It dropped to 20–26 GB on two subsequent runs. The graph shows that OS page cache isn’t enough for caching 595 GB of data, so the data had to be re-read from NVMe drive during subsequent runs.
The next graph is for disk bandwidth usage:
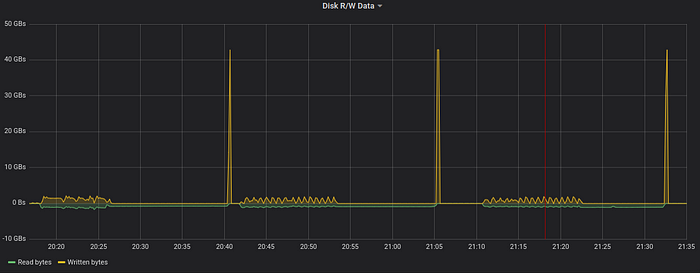
40 GB/s temporary file deletion peaks prevent from reading the graph, so let’s remove them:
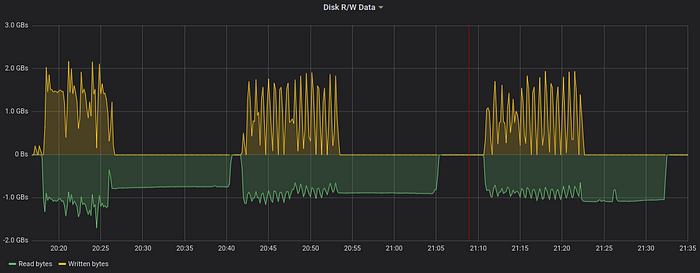
Now we see that VictoriaMetrics reads data into temporary files at the speed around 1 GB/sec and then continues reading the data from temporary files at roughly the same speed.
Note that the data is constantly read from the disk during query execution — it is read from the database files during the first stage and then it is read from temporary file during the second stage. It isn’t read from OS page cache, since:
- The page cache is too small for holding all the data (384 GB of RAM vs 595 GB of data).
- The previously cached data is evicted from the page cache by recently read data, so it is missing on subsequent runs.
Now let’s look at disk io usage:
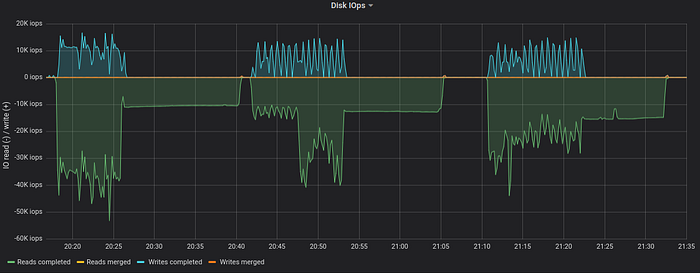
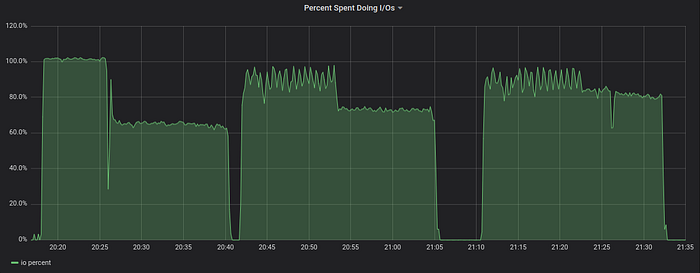
NVMe drive reached its capacity at 10K read iops (1 GB/sec) plus 35K write iops (1.5 GB/sec) when parallel queries from this script were executed during 20:18–20:40.
The last graph is for CPU usage:
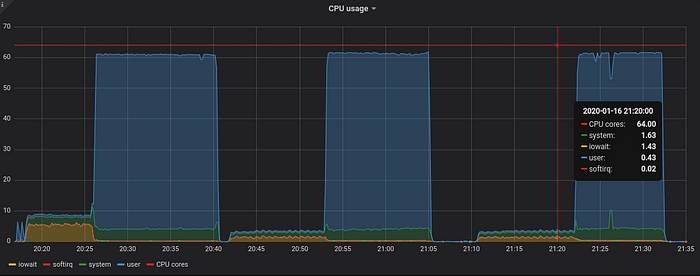
The first run required more system and iowait CPU time during the first stage, since VictoriaMetrics was executing multiple queries in parallel from this script.
Two stages for query execution in VictoriaMetrics are clearly visible from graphs above:
- Low CPU usage and high disk io usage when fetching data from database into a temporary file.
- High CPU usage during data scan from temporary files. The second stage scales to all the available CPU cores. Scan speed exceeds one billion of data points per second on a single node during this stage according to the graph above.
Query performance analysis
Benchmark results show that query performance for VictoriaMetrics depends on the following aspects:
- The amount of data that needs to be read from database during the query. Smaller amounts of data mean higher performance. Typical queries for time series applications usually scan relatively small amounts of data, i.e.
select temperature trend for a dozen of sensors over short period of time, so they are executed with sub-millisecond latency on a database with trillions of data points. - Disk bandwidth and iops. Higher available bandwidth and iops improve performance for heavy queries over data that is missing in OS page cache. Note that recently added and recently queried data is usually available in the OS page cache, so VictoriaMetrics works fast on low-iops low-bandwidth HDDs for typical queries on recently added data.
- The number of available CPU cores. Higher number of CPU cores improves performance for the second stage of the query.
VictoriaMetrics provides good on-disk compression for real-world time series data — see this article for details. The data from Billy benchmark is compressed to less than 1.2 bytes per sample — see disk space usage graph in the data ingestion chapter above. This is above average comparing to production numbers VictoriaMetrics users report (0.4–0.8 bytes per sample), because adjacent temperature measurements in Billy benchmark are independent of each other, while real-world temperature measurements highly correlate over short periods of time. So queries over real-world data should have better performance and lower disk io usage, since such data should require less disk storage due to higher compression rates.
Conclusions
VictoriaMetrics scales perfectly during data ingestion — it achieves 66 million of data points per second (66 000 000 NVPS) average ingestion speed on a single n2.xlarge.x86 node. The NVMe drive load doesn’t exceed 20% during the data ingestion at this speed.
VictoriaMetrics achieves scan speed of 380 millions rows per second on a single n2.xlarge.x86 node when performing query over all the 525.6 billion of rows. It achieves scan speed of more than one billion rows per second during the second stage of the query.
Try running Billy benchmark on your hardware and post results in comments. Share results for cluster version of VictoriaMetrics. We are going to publish our results for cluster version in a separate post. In the mean time you can read other interesting posts related to VictoriaMetrics.
Thanks to Packet for providing an excellent high-end hardware for the benchmark!
Update: Single-node VictoriaMetrics v1.35.0 (and newer versions) doesn’t write data to temporary files before query processing — it reads the data directly from the storage. This should improve performance numbers by up to 2x comparing to numbers from this article.
